SHANGHAI, Aug. 12 /PRNewswire-Asia/ -- WuXi PharmaTech (Cayman) Inc. (NYSE: WX), a leading research and development outsourcing company serving the pharmaceutical, biotechnology, and medical device industries, with operations in China and the United States, today announced its financial results for second-quarter 2009.
(Logo: http://www.prnasia.com/sa/2009/04/01/200904011147.jpg )
Second-Quarter 2009 Highlights
-- Net revenues totaled $67.0 million
-- Laboratory Services net revenues increased 19% year over year to $61.5
million
-- China-based Laboratory Services net revenues grew 26% year over year to
$44.8 million
-- U.S.-based Laboratory Services net revenues increased 4% year over year
to $16.7 million
-- Manufacturing Services net revenues decreased 69% year over year to
$5.5 million
-- GAAP diluted earnings per ADS grew 72% year over year to 20 cents
-- Non-GAAP diluted earnings per ADS grew 7% year over year to 24 cents
Management Comment
"WuXi PharmaTech's overall financial performance in the second quarter exceeded our expectations, both in revenues and profitability, building confidence that we will meet our previously announced guidance for revenues and beat our previously announced guidance for adjusted EBITDA for the full year," said Dr. Ge Li, Chairman and Chief Executive Officer. "The company is achieving its current financial goals in a difficult operating environment while investing in new growth opportunities that we expect will drive revenue and income growth over the next several years.
"Our current success reflects our sound business model and expanding capabilities. Our core capabilities in discovery chemistry continue to deliver a large portion of our revenues and revenue growth. In recent years, we have been building new capabilities in discovery biology, DMPK/ADME, formulation, toxicology, bioanalytical services, process research, analytical development services, and other areas. These newer services have become increasingly significant revenue growth drivers as we offer an integrated platform of services. We have also expanded our services beyond development of small-molecule pharmaceuticals to include testing services for biologics and medical-device products.
"In our short history, WuXi PharmaTech has grown to become a leading contract research organization providing integrated R&D services to the global life science industries. Our mission as a company is to partner with the world's leading life science and medical device companies to help them improve the success of research and shorten the time of development," Dr. Li concluded.
GAAP Results
Second-quarter 2009 net revenues decreased 3% year over year to $67.0 million due to a 69% decline in Manufacturing Services net revenues, offset by 19% growth in Laboratory Services net revenues. Manufacturing Services net revenues are inherently variable due to fluctuating demand and customer delivery schedules, and the majority of the year-over-year decline in Manufacturing Services net revenues came from large projects in 2008 that did not recur in 2009. In addition, Manufacturing Services net revenues in second-quarter 2009 were impacted by project mix that included more early-stage projects. Laboratory Services net revenues in second-quarter 2009 benefited from stronger demand for our integrated drug discovery and development services, particularly in DMPK/ADME, bioanalytical services, discovery biology, process research, analytical development services, formulation development, and our core discovery chemistry services.
Second-quarter 2009 GAAP gross profit increased 7% year over year to $27.1 million, mainly due to an increased contribution from Laboratory Services, driven by both revenue growth and gross-margin improvement, offset by a decline in the gross-profit contribution of Manufacturing Services from lower revenues and lower gross margin. Second-quarter 2009 GAAP gross margin improved year over year to 40% from 37%, mainly due to lower amortization expenses for acquired intangible assets as a result of a lower balance for these assets following impairment charges taken in fourth-quarter 2008. Gross margin from Laboratory Services improved year over year to 43% from 38%, also mainly due to lower intangible amortization. Partially offsetting this benefit, gross margin declined year over year in Manufacturing Services to 15% from 32% due primarily to unfavorable project mix and inventory write-downs.
Second-quarter 2009 GAAP operating income increased 22% year over year to $13.6 million due to the 7% increase in gross profit and a 5% decline in operating expenses. Second-quarter 2009 GAAP operating expenses declined 5% year over year to $13.4 million due to a 10% decline in general and administrative expenses resulting from cost control and improved operating efficiency, partially offset by a 29% increase in selling and marketing expenses resulting from expanded business development efforts.
Second-quarter 2009 GAAP net income from continuing operations increased 37% year over year to $14.7 million due to the 22% increase in operating income and a favorable change in other income (expenses) net, offset by higher tax expense. Other income (expenses) net in second-quarter 2009 included gains from foreign-exchange forward contracts of $0.3 million, compared to losses of $1.4 million on such contracts in second-quarter 2008. Taxes in second-quarter 2009 were $2.1 million, or 12% of pretax income. In the prior-year period, a larger tax benefit was recorded mainly due to the deferred tax impact from amortization of acquired intangible assets.
Second-quarter 2009 GAAP net income grew 72% year over year due to the 37% increase in net income from continuing operations and no losses from discontinued operations. Second-quarter 2008 GAAP net income included a loss from discontinued operations related to the biologics manufacturing business. There was no impact from discontinued operations in second-quarter 2009, as these operations had ceased. Second-quarter 2009 GAAP diluted earnings per ADS grew 72% year over year to 20 cents, compared to 12 cents in second-quarter 2008.
Non-GAAP Results
Non-GAAP financial results excluded the impact of share-based compensation expenses, amortization and the deferred tax impact of acquired intangible assets, and losses from discontinued operations.
Second-quarter 2009 non-GAAP gross profit decreased 6% year over year to $28.4 million, mainly due to a decline in the gross-profit contribution from Manufacturing Services due to lower revenues and lower gross margins, partially offset by the favorable impact of higher gross profit in the Laboratory Services business. Second-quarter 2009 non-GAAP gross margin declined year over year to 42% from 44% due to lower gross margin in the Manufacturing Services business from unfavorable project mix and inventory write-downs.
Second-quarter 2009 non-GAAP operating income declined 9% year over year to $17.1 million primarily due to the decline in non-GAAP gross profit. Operating expenses were essentially flat compared to the same period of 2008.
Second-quarter 2009 non-GAAP net income grew 7% year over year to $17.8 million due to a favorable change in other income (expenses) net, which more than offset the 9% decrease in non-GAAP operating income and higher taxes. Changes in other income (expenses) net and taxes are discussed above for GAAP results. Diluted non-GAAP earnings per ADS from continuing operations grew 7% year over year to 24 cents compared to 23 cents in second-quarter 2008.
(See the table titled Reconciliation of GAAP to Non-GAAP below).
2009 Financial Guidance
We update our full-year 2009 financial guidance as follows:
-- We reconfirm our expectation for total net revenues of $265-$275
million
-- We now anticipate growth in net revenues of China-based Laboratory
Services of 20-23%, compared to our previous guidance of 15-20%
-- We now project that full-year 2009 net revenues of U.S.-based
Laboratory Services will increase slightly
-- We expect adjusted EBITDA (excluding share-based compensation charges
and potential mark-to-market gains or losses from foreign-currency
forward contracts) of $80-$85 million, compared to previous guidance of
$72 million
-- We project full-year 2009 Manufacturing Services net revenues of $20-
$30 million
Commenting on financial performance and guidance, Edward Hu, Chief Operating Officer and acting Chief Financial Officer, said, "Our second-quarter 2009 financial results exceeded our expectations and give us reason to reconfirm our full-year 2009 revenue guidance and increase our full-year 2009 adjusted EBITDA estimate to $80-$85 million. Second-quarter 2009 net revenues grew 13% versus first-quarter 2009. Laboratory Services net revenue growth of 19% year-over-year reflected growing demand for our platform of integrated services. As anticipated, Manufacturing Services net revenues were still light in the second quarter due to project delays and project mix, and we expect revenues in this business for this year to be in the range of $20-$30 million, depending on delivery schedules. As previously discussed, we expect total gross margin will decline in second-half 2009 as we increase hiring and continue investments."
WUXI PHARMATECH (CAYMAN) INC.
UNAUDITED CONSOLIDATED BALANCE SHEETS
(in thousands of U.S. dollars, except ordinary share, ADS and par value data)
June 30, December 31,
2009 2008
Assets:
Current assets:
Cash and cash equivalents 92,215 56,624
Restricted cash 1,645 1,338
Short-term investment 10,246 14,631
Accounts receivable, net 45,982 36,457
Inventories 6,632 6,926
Prepaid expenses and other current assets 10,149 7,281
Assets of discontinued operations (Note 1, 2) 3,754 6,508
Total current assets 170,623 129,765
Non-current assets:
Goodwill 23,956 23,956
Property, plant and equipment, net 169,257 152,704
Intangible assets, net 8,231 9,934
Prepaid land use rights 5,363 5,424
Deferred tax assets 8,836 8,807
Other non-current assets 5,965 5,809
Total non-current assets 221,608 206,634
Total assets 392,231 336,399
Liabilities and shareholders' equity:
Current liabilities:
Short-term and current portion of long-term debt 47,179 7,558
Accounts payable 23,295 19,829
Accrued expenses 11,865 14,279
Deferred revenue 3,837 3,373
Advanced subsidies 3,047 3,080
Other taxes payable 3,320 5,742
Other current liabilities 5,319 3,448
Liabilities of discontinued operations (Note 1) 83 1,495
Total current liabilities 97,945 58,804
Non-current liabilities:
Long-term debt, excluding current portion 2,242 2,305
Advanced subsidies 1,706 1,819
Convertible notes 35,864 35,864
Other non-current liabilities 7,389 6,731
Total non-current liabilities 47,201 46,719
Total liabilities 145,146 105,523
Shareholders' equity:
Ordinary shares ($0.02 par value, 5,002,500,000
authorized as of June 30, 2009 and December
31, 2008, respectively; 544,157,080 and
529,385,590 issued and outstanding as of
June 30, 2009, and December 31, 2008,
respectively) 10,883 10,588
Additional paid-in capital 314,329 324,629
Accumulated deficit (95,084) (121,505)
Accumulated other comprehensive income 16,957 17,164
Total shareholders' equity 247,085 230,876
Total liabilities and shareholders' equity 392,231 336,399
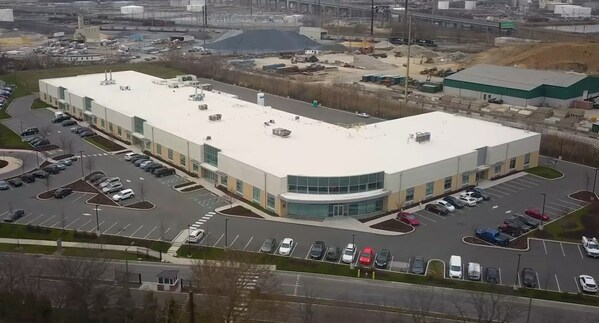
Note 1: The biologics manufacturing operations in Philadelphia, which
management decided to close in December 2008, were classified as
discontinued operations.
Note 2: Assets of discontinued operations included assets held for sale
of $ 3,744,000 as of June 30, 2009.
WUXI PHARMATECH (CAYMAN) INC.
UNAUDITED CONDENSED CONSOLIDATED STATEMENTS OF OPERATIONS
(In thousands of U.S. dollars, except ADS data and per ADS data)
Three Months Ended Six Months Ended
June 30, June 30,
% %
2009 2008 Change 2009 2008 Change
(Note 3)
Net revenues:
Laboratory Services 61,489 51,526 19% 118,084 94,042 26%
Manufacturing
Services 5,464 17,556 (69%) 8,017 31,208 (74%)
Total net revenues 66,953 69,082 (3%) 126,101 125,250 1%
Cost of revenues:
Laboratory Services (35,204) (31,701) 11% (69,059) (54,305) 27%
Manufacturing
Services (4,670) (11,985)(61%) (6,643) (19,353) (66%)
Total cost of
revenues (39,874) (43,686) (9%) (75,702) (73,658) 3%
Gross profit:
Laboratory Services 26,285 19,825 33% 49,025 39,737 23%
Manufacturing Services 795 5,571 (86%) 1,374 11,855 (88%)
Total gross profit 27,080 25,396 7% 50,399 51,592 (2%)
Operating expenses:
Selling and marketing
expenses (2,413) (1,872) 29% (3,747) (3,226) 16%
General and
administrative
expenses (11,031) (12,321)(10%) (22,741) (23,457) (3%)
Total operating
Expenses (13,444) (14,193) (5%) (26,488) (26,683) (1%)
Operating income 13,636 11,203 22% 23,911 24,909 (4%)
Other income
(expenses), net:
Other income
(expenses), net 2,975 (2,281) * 6,368 527 *
Interest income
(expenses), net 144 (21) * 94 495 *
Total other income
(expenses), net 3,119 (2,302) * 6,462 1,022 *
Income from continuing
operations
before income taxes 16,755 8,901 88% 30,373 25,931 17%
Income tax (expenses)
benefit (2,069) 1,795 * (3,952) (66) *
Income from continuing
operations 14,686 10,696 37% 26,421 25,865 2%
Loss on discontinued
operations,
net (Note 1)
Loss from operations
of discontinued
component -- (3,478) * -- (5,522) *
Income tax benefit -- 1,302 * -- 2,038 *
Loss on discontinued
operations -- (2,176) * -- (3,484) *
Net income 14,686 8,520 72% 26,421 22,381 18%
Basic net earnings
(loss) per ADS:
Earnings from
continuing
operations 0.22 0.17 26% 0.39 0.42 (6%)
Loss on discontinued
operations-
net of tax (Note 1) -- (0.03) * -- (0.06) *
Net earnings per ADS 0.22 0.14 59% 0.39 0.36 9%
Weighted average
ADS outstanding-
basic 67,944,436 662,588,246 67,469,104 62,241,856
Diluted net
earnings
(loss) per ADS:
Earnings from
continuing
operations 0.20 0.15 37% 0.36 0.36 1%
Loss on
discontinued
operations-
net of tax
(Note 1) -- (0.03) * -- (0.05) *
Net earnings
per ADS 0.20 0.12 72% 0.36 0.31 17%
Weighted
average ADS
outstanding-
diluted 73,152,798 72,949,790 73,356,170 72,731,304
* Not meaningful
Note 3: Financial results of AppTec were consolidated as of January 31,
2008.
WUXI PHARMATECH (CAYMAN) INC.
RECONCILIATION OF GAAP TO NON-GAAP
(in thousands of U.S. dollars, except ADS data and per ADS data)
Three Months Ended Six Months Ended
June 30, June 30,
2009 2008 % 2009 2008 %
GAAP gross profit-
continuing
operations 27,080 25,396 7% 50,399 51,592 (2%)
GAAP gross margin-
continuing
operations 40% 37% 40% 41%
Adjustments:
Share-based
compensation 562 645 1,153 1,344
Amortization of
acquired intangible
assets 764 4,166 1,528 4,550
Non-GAAP gross profit 28,406 30,207 (6%) 53,080 57,486 (8%)
Non-GAAP gross margin 42% 44% 42% 46%
GAAP operating
income-continuing
operations 13,636 11,203 22% 23,911 24,909 (4%)
GAAP operating
margin-continuing
operations 20% 16% 19% 20%
Adjustments:
Share-based
compensation 2,659 3,419 4,658 6,397
Amortization of
acquired
intangible assets 764 4,166 1,528 4,550
Non-GAAP operating
Income 17,059 18,788 (9%) 30,097 35,856 (16%)
Non-GAAP operating
margin 25% 27% 24% 29%
GAAP net income-
continuing
operations 14,686 10,696 37% 26,421 25,865 2%
GAAP net margin-
continuing
operations 22% 15% 21% 21%
Adjustments:
Share-based
compensation 2,659 3,419 4,658 6,397
Amortization of
acquired
intangible assets 764 4,166 1,528 4,550
Deferred tax impact
related
to acquired
intangible assets (296) (1,632) (592) (1,784)
Non-GAAP net income 17,813 16,649 7% 32,015 35,028 (9%)
Non-GAAP net margin 27% 24% 25% 28%
GAAP net income 14,686 8,520 72% 26,421 22,381 18%
Add back:
Depreciation and
amortization 5,620 10,672 10,627 15,526
Interest (income)
expenses, net (144) 21 (94) (495)
Income tax expenses 2,069 (3,097) 3,952 (1,972)
EBITDA 22,231 16,116 38% 40,906 35,440 15%
Adjustments:
Share-based
compensation 2,659 3,419 4,658 6,397
Mark-to-market
gains (losses)
from foreign-
currency forward
contracts 401 2,515 (2,219) (168)
Adjusted EBITDA 25,291 22,050 15% 43,345 41,669 4%
Income attributable to
holders of ADS
(Non-GAAP):
Basic 17,813 16,649 7% 32,015 35,028 (9%)
Diluted 17,813 16,649 7% 32,015 35,028 (9%)
Basic earnings per ADS
(Non-GAAP) 0.26 0.27 (1%) 0.47 0.56 (16%)
Diluted earnings per ADS
(Non-GAAP) 0.24 0.23 7% 0.44 0.48 (9%)
Weighted average ADS
outstanding - basic
(Non-GAAP) 67,944,436 62,588,246 67,469,104 62,241,856
Weighted average ADS
outstanding -
diluted (Non-GAAP) 73,152,798 72,949,790 73,356,170 72,731,304
WUXI PHARMATECH (CAYMAN) INC.
REVENUE BREAKDOWN
(in thousands of U.S. dollars)
Three Months Ended Six Months Ended
June 30, June 30,
2009 2008 % 2009 2008 %
Net revenues:
China-based Laboratory
Services 44,810 35,564 26% 86,458 67,983 27%
U.S.-based Laboratory
Services* 16,679 15,962 4% 31,626 26,059 21%
Subtotal 61,489 51,526 19% 118,084 94,042 26%
China-based Manufacturing
Services 5,464 17,556 (69%) 8,017 31,208 (74%)
Total net revenues 66,953 69,082 (3%)126,101 125,250 1%
* Only five months of revenues (February to June 2008) were included in
2008 for U.S.-based Laboratory Services because that business was
acquired on January 31, 2008.
Conference Call
WuXi PharmaTech senior management will host a conference call at 8:00 am (Eastern) / 5:00 am (Pacific) / 8:00 pm (Beijing/Shanghai/Hong Kong) on Wednesday, August 12, 2009, to discuss its second-quarter 2009 financial results and future prospects. The conference call may be accessed by calling:
United States: 1-866-519-4004
China (Landline): 800-819-0121
China (Mobile): 400-620-8038
Hong Kong: 800-933-053
United Kingdom: 0-808-234-6646
International: +65-6735-7955
Conference ID: 96870349
Web PIN: 8656
A telephone replay will be available two hours after the call's completion at:
United States: 1-866-214-5335
China North: 10-800-714-0386
China South: 10-800-140-0386
Hong Kong: 800-901-596
United Kingdom: 0-800-731-7846
International: +61-2-8235-5000
Passcode: 96870349
A live webcast of the conference call and replay will be available on the investor relations page of WuXi PharmaTech's website at http://www.wuxiapptec.com
About WuXi PharmaTech
WuXi PharmaTech is a leading pharmaceutical, biotechnology, and medical device R&D outsourcing company, with operations in China and the United States. As a research-driven and customer-focused company, WuXi PharmaTech provides broad and integrated portfolio of laboratory and manufacturing services throughout the drug and medical device R&D process. WuXi PharmaTech's services are designed to assist its global partners in shortening the cycle and lowering the cost of drug and medical device R&D. WuXi PharmaTech's operating subsidiaries are known as WuXi AppTec. For more information, please visit: http://www.wuxiapptec.com.
Use of Non-GAAP Financial Measures
We have provided three-month and six-month 2008 and 2009 gross profit, operating income, net income and earnings per ADS on a non-GAAP basis, which excludes share-based compensation expenses, amortization and deferred tax impact of acquired intangible assets, and discontinued operations. We also provided three-month and six-month 2008 and 2009 adjusted EBITDA, which is the GAAP net income adjusted by adding back depreciation and amortization, interest, income taxes, share-based compensation and mark-to-market gains (losses) from foreign-currency forward contracts. We believe both management and investors benefit from referring to these non-GAAP measures in assessing our financial performance and liquidity and when planning and forecasting future periods. These non-GAAP operating measures are useful for understanding and assessing underlying business performance and operating trends. We expect to continue providing gross profit, operating income, and net income on a non-GAAP basis using a consistent method on a quarterly basis.
You should not view non-GAAP results on a stand-alone basis or as a substitute for results under GAAP, or as being comparable to results reported or forecasted by other companies, and should refer to the reconciliation of non-GAAP measures to GAAP measures for the indicated periods attached hereto.
Cautionary Note Regarding Forward-Looking Statements
Statements in this release contain "forward-looking" statements within the meaning of Section 27A of the Securities Act of 1933, as amended, and Section 21E of the Securities Exchange Act of 1934, as amended, and as defined in the Private Securities Litigation Reform Act of 1995, including, among others, anticipated full-year, second-half, and third-quarter 2009 operating results (including estimated total net revenues, China-based Laboratory Services net revenues, Manufacturing Services net revenues, adjusted EBITDA, gross margins, and other trends), planned capital expenditure and investment levels, and the anticipated benefits of those efforts and the planned expansion of our service offerings and areas of related revenue growth.
These forward-looking statements are not historical facts but instead represent only our belief regarding future events, many of which, by their nature, are inherently uncertain and outside of our control. Our actual results and financial condition and other circumstances may differ, possibly materially, from the anticipated results and financial condition indicated in these forward-looking statements. Among other factors, continued uncertainty in the global economy and the pressures being felt by our customers and pharmaceutical industry consolidation may adversely impact our business and the trends for outsourced R&D and manufacturing for longer than expected or more severely than expected; we may be unable to successfully make our planned investments and capital expenditures on a timely basis; these investments may not yield the desired results; we may need to modify the nature and level of our investments and capital expenditures; pharmaceutical companies may not change their business models as expected or in a manner favorable to us; we may fail to capitalize on the opportunities presented; we may not maintain our preferred provider status with our clients; and we may be unable to successfully expand our capabilities to meet client needs. In addition, other factors that could cause our actual results to differ from what we currently anticipate include our limited operating history; failure to generate sufficient future cash flows or secure any required future financing on acceptable terms or at all; failure to retain key personnel; effective integration of continuing products and services from AppTec; our reliance on a limited number of customers to continue to account for a high percentage of our revenues; risk of payment failure by any of our large customers, which could significantly harm our cash flows and profitability; dependence upon the continued service of our senior management and key scientific personnel; and our ability to retain our existing customers or expand our customer base. You should read the financial information contained in this release in conjunction with the consolidated and pro-forma financial statements and related notes thereto included in our 2008 Annual Report on Form 20-F filed with and available on the Securities and Exchange Commission's website at http://www.sec.gov. For additional information on these and other important factors that could adversely affect our business, financial condition, results of operations and prospects, see "Risk Factors" beginning on page 6 of our 2008 Annual Report on Form 20-F. Our results of operations for second-quarter 2009 are not necessarily indicative of our operating results for any future periods. All projections in this release are based on limited information currently available to us, which is subject to change. Although these projections and the factors influencing them will likely change, we undertake no obligation to update or revise these forward-looking statements, whether as a result of new information, future events or otherwise, after the date of this press release, except as required by law. Such information speaks only as of the date of this release.
For more information, please contact:
WuXi PharmaTech (Cayman) Inc.
Ronald Aldridge (for investors)
Director of Investor Relations
Tel: +1-201-585-2048
Email: ir@wuxiapptec.com
Stephanie Liu (for the media)
WuXi PharmaTech (Cayman) Inc.
Tel: +86-21-5046-4362
Email: pr@wuxiapptec.com